> For the complete documentation index, see [llms.txt](https://taskoncommunitys-organization.gitbook.io/entity-hub-for-business-end/llms.txt). Markdown versions of documentation pages are available by appending `.md` to page URLs; this page is available as [Markdown](https://taskoncommunitys-organization.gitbook.io/entity-hub-for-business-end/other-settings/analytics.md).
# Analytics
Analytics encompasses the Quest Hub and Community Hub.
## **Quest Hub**
The Quest Hub provides an intuitive overview of all relevant data related to task participants, submitters, users eligible for tasks, and ongoing tasks within the community.
It also offers detailed data analysis for `Quest`, `Event`, `Referral`, and more.
## **Community Hub**
The Insights Center in the Community Hub allows you to view data on visitors, followers, and active community members, along with visualized trend charts.
You can intuitively observe participation trends for all past tasks within the community and detailed data on invitation completion through charts.
## **Bot Guard**
The TaskOn community is dedicated to helping project teams build high-quality communities.
A robust bot detection system effectively distinguishes between bot users and real users, enabling the identification of genuinely high-quality participants.
Here, the system displays the number and proportion of bot users filtered out by TaskOn’s anti-bot functionality, along with data trends over the past 7D/30D/all , providing clear insights into why bot users are detected.
## **Invitations**
This section offers a clearer view of the number of invited Visitors, Followers, Qualifiers, and Inviters, as well as the final conversion effects and trend changes over the past 7D/30D/all , presented in a curve chart.
Below, an invitation leaderboard displays the ranking of users with the highest number of invitations within the community.
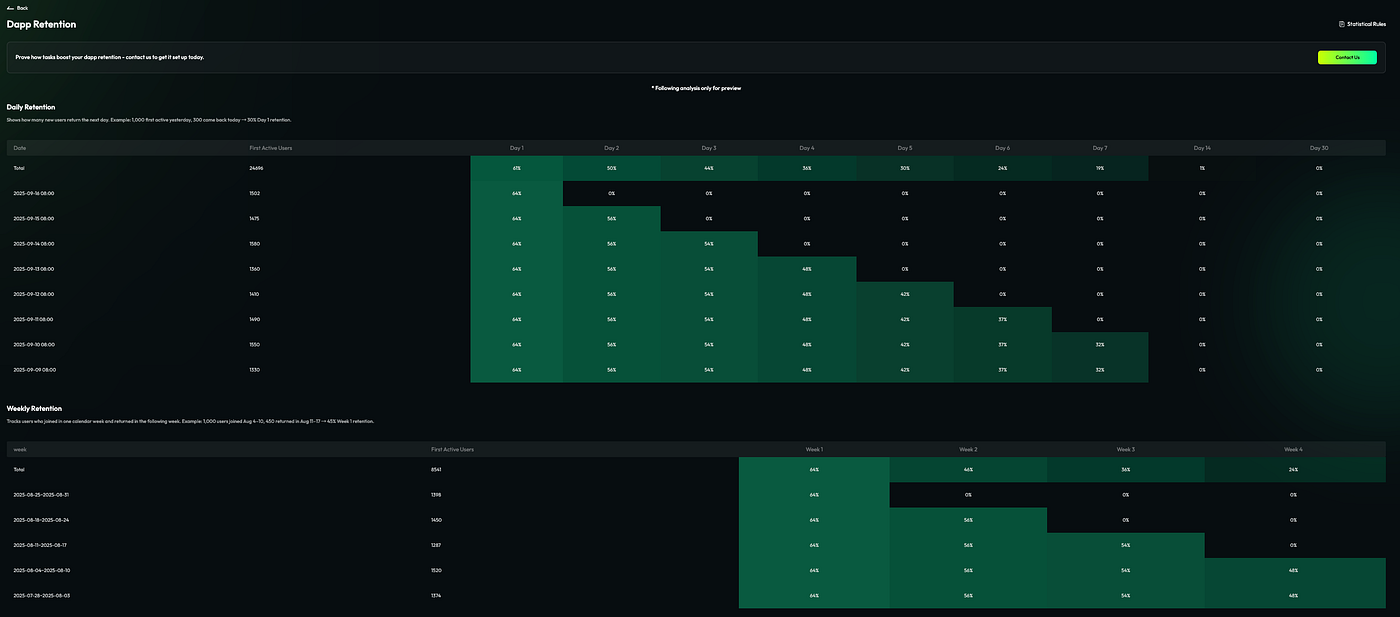
## **Dapp Retention**
The new TaskOn version introduces a Dapp Retention Rate section within the Data Analytics module. This addition provides visualized charts, allowing clients to intuitively observe the retention metrics behind each campaign for more refined operations.
Press enter or click to view image in full size
**Daily Retention Chart:**
* Daily Retention:\
Shows how many new users return on the next day. Example: If there were 1,000 first-time active users yesterday, and 300 return today → the Day 1 retention rate is 30%.
* Weekly Retention:\
Tracks users who joined during a specific calendar week and returned the following week. Example: 1,000 users joined between Aug 4–10, and 450 of them returned between Aug 11–17 → the Week 1 retention rate is 45%.